Deprecated: Creation of dynamic property PBC\Blocks\Brightcove::$attributes is deprecated in /var/www/html/public/content/themes/pbc/classes/Abstracts/Block.php on line 20
Deprecated: Creation of dynamic property PBC\Blocks\Highlight::$attributes is deprecated in /var/www/html/public/content/themes/pbc/classes/Abstracts/Block.php on line 20
Deprecated: Creation of dynamic property PBC\Blocks\Highlight::$content is deprecated in /var/www/html/public/content/themes/pbc/classes/Abstracts/Block.php on line 23
Deprecated: Creation of dynamic property PBC\Blocks\ResearchPaper::$attributes is deprecated in /var/www/html/public/content/themes/pbc/classes/Abstracts/Block.php on line 20
Deprecated: Creation of dynamic property PBC\Blocks\ContentSection::$attributes is deprecated in /var/www/html/public/content/themes/pbc/classes/Abstracts/Block.php on line 20
Deprecated: Creation of dynamic property PBC\Blocks\ContentSection::$content is deprecated in /var/www/html/public/content/themes/pbc/classes/Abstracts/Block.php on line 23
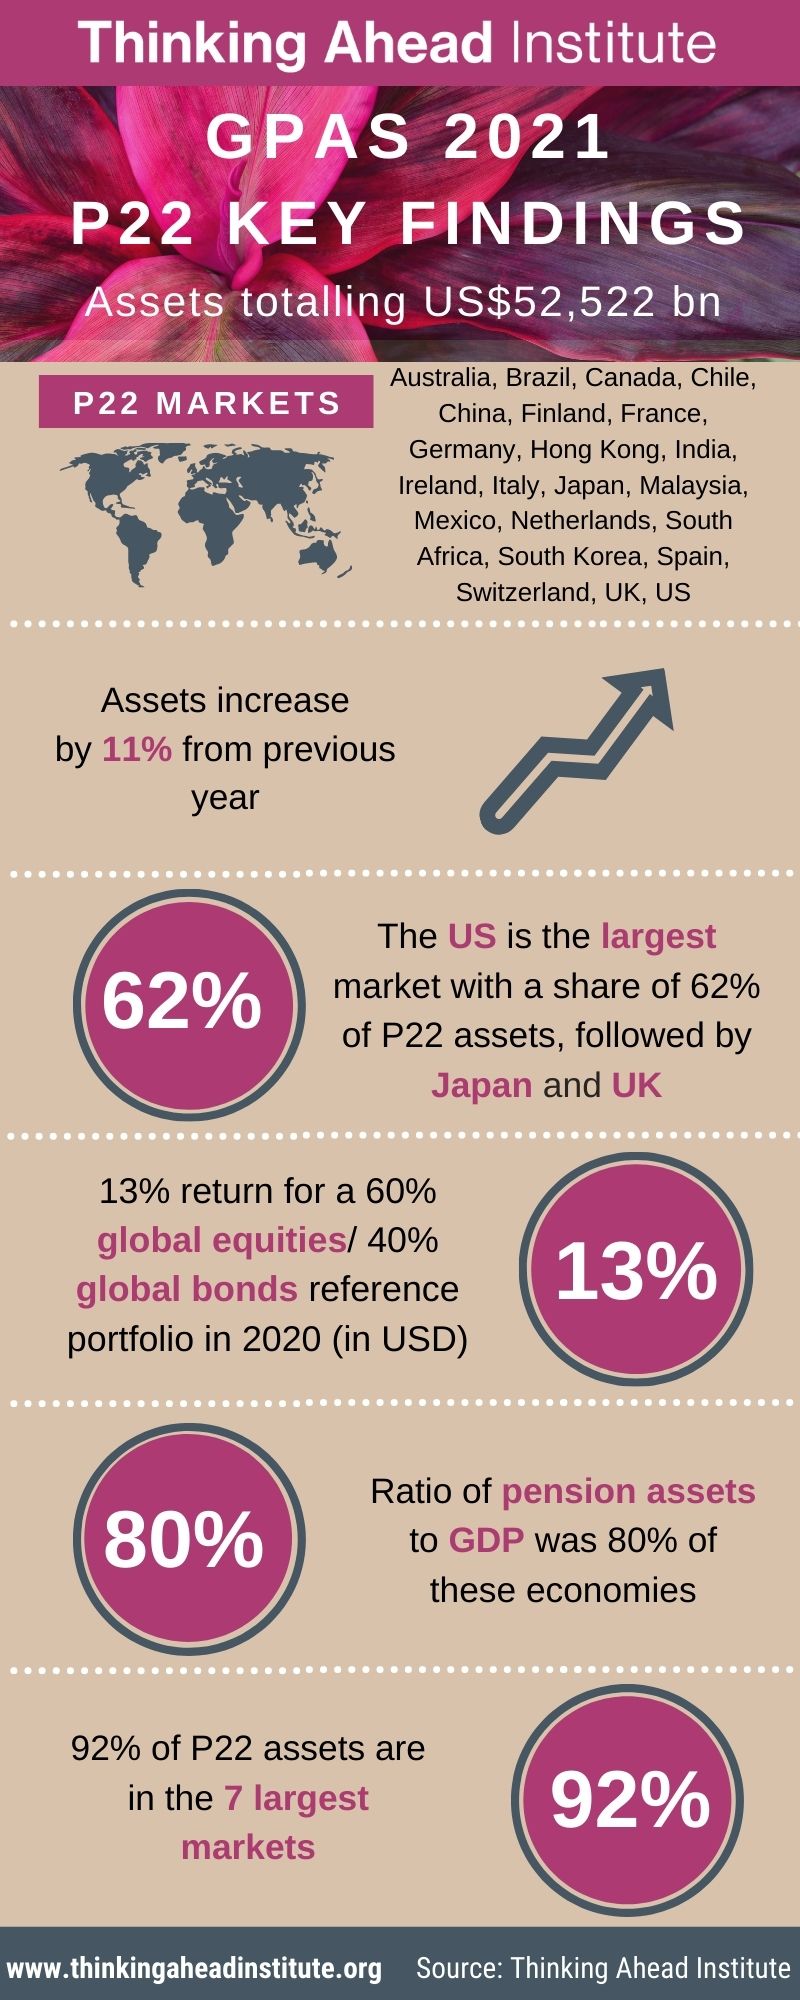
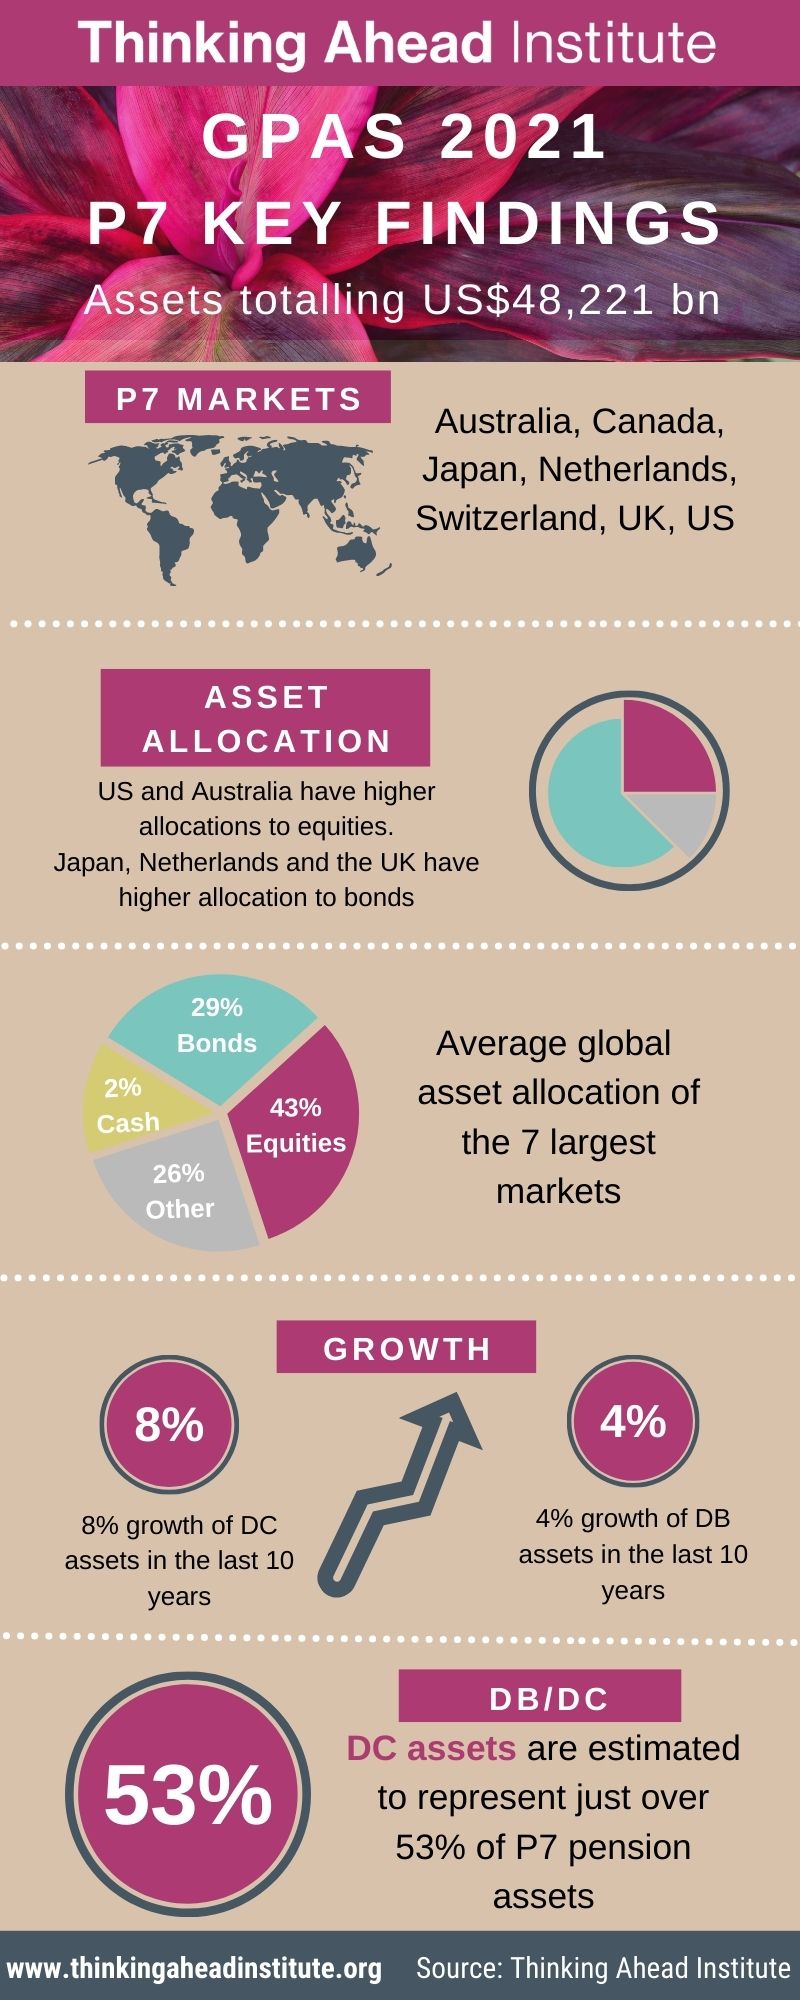
The Global Pension Assets Study covers 22 major pension markets (the P22), which now totals US$52,522 billion in pension assets and account for 80% of the GDP of these economies. The study includes an analysis of the seven largest markets (the P7) which includes Australia, Canada, Japan, Netherlands, Switzerland, UK and US and comprises 92% of total pension assets. View full report.
Key findings from the last 20 years of global pension assets growth
- #1 market: Australia
The most successful pensions market can be found in Australia, featuring 20-year pension asset growth of 11.3% per annum, in USD terms. The critical features in this success have been government-mandated pension contributions, a competitive institutional model and the dominance of DC - #1 pension design: Defined Contribution
The 20-year growth of DC in the P7 has been 7.8% per annum relative to 4.1% per annum for DB, in USD terms. DC has worked better for employers who have had declining appetite for taking pension risk during this 20-year period - #1 asset class: Private Assets
The asset allocation to real estate, private equity and infrastructure in the 20-year period has moved from about 7% to above 26%. Alternatives have been attractive for return reasons, offsetting their governance difficulties - #1 meme: Governance
The governance of pension funds has been a growing source of attention fanned by successive industry reviews – ERISA in the US; Myners in the UK; Royal Commission and Productivity Commission in Australia. Pension governance is a lot stronger than 20 years ago - #1 missed opportunity: Stewardship
The 20-year story is one of missing the opportunity to influence and mitigate corporate misalignments – like executive pay, and other poor leadership and boardroom practices - #1 no-show: Technology
The technology impacts on pension funds have been surprisingly light as evidenced by legacy systems that rely heavily on spreadsheets. The prioritisation of technological innovation hasn’t changed much over the 20 years.


